Posted by mybudget360
November 30, 2010
The typical American family is facing the biggest economic uncertainty since the Great Depression and must feel like their lives are in a washer spin cycle. Many unemployed Americans are now entering a stage where unemployment insurance is being cut off which will send tens of thousands of people into the street. The mainstream media won't cover this because they rather gossip about the next tan face to drink themselves into a gutter at a nightclub. 43 million Americans are receiving some kind of food assistance yet this is some kind of recovery? Many are wondering how banks can produce such large profits without actually producing anything real or of substance in the economy. Yet banks are largely casinos that now operate to siphon off real wealth from the economy through bailouts, frauds, and other activities that harm the overall economy. In a decade where banks were unleashed to do what they may with limited regulation and a cozy Fed, we are now left with an economy in tatters but a banking sector that is still healthy based on oversized bonuses. I wanted to gather data over the last 60 years and measure how most Americans are now fairing. The data shows a largely underwater nation.
Let us look at the data carefully:

Back in 1950 the median home price cost a little above 2 times the annual median household income:
1950: $7354 / $3,319 =2.2
In 1960 the ratio remained roughly the same:
1960: $11,900 / $5,620 = 2.1
In fact, over this ten year period the typical household gained buying power when it came to housing. Even in 1970 the ratio became more favorable to US households:
1970: $17,000 / $9,867 =1.7
This was the lowest point at the start of any decade in modern history. After this point, with all the push for deregulation and allowing Wall Street to run rampant prices remained fairly stable only because of the two income household (that is until we hit 2000):
1980: $47,200 / $21,023 = 2.2
1990: $79,100 / $35,353 = 2.2
2000: $119,600 / $50,732 = 2.3
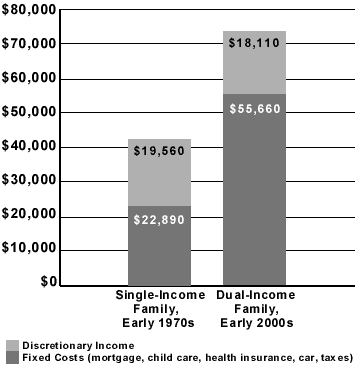
This was sustained via the two income household:
After this point, things went haywire. Incomes went stagnant or dropped yet home prices sky rocketed. Even today after the severe correction the ratio is still out of sync with 50 years of data:
2010: $170,500 / $50,221 = 3.3
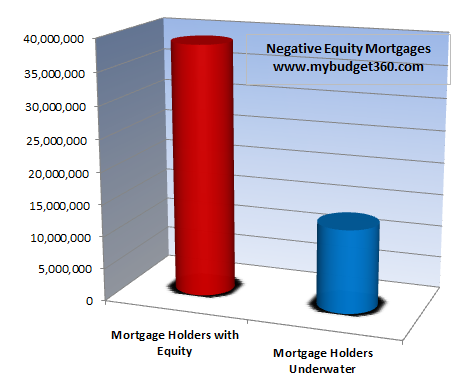
In fact, given the current income levels the median nationwide home price should be down to $119,000 (a 30% drop from current levels). Some will argue that we should factor in for inflation. This would only be the case if we also saw wage growth. For the first time in modern history did we see wages stagnant for an entire decade. So the average American family is still looking at inflated assets and that is why we have millions of people sitting in underwater homes:Just think of what negative equity represents. It represents a household that has over paid for a home. I don't think the desire to own a home has dramatically gone up or down in the last fifty years. Homeownership has always been a big part of the American Dream. But what happened over the last ten years is that banks were able to get their grubby hands on mortgages and convert them into another commodity where they could place large bets and ultimately push losses to taxpayers. People that over paid are paying via foreclosure. What is the penalty that banks are paying? That is why now that banks have raided and had their way with housing, they are looking for other markets to gamble in (with taxpayer money). The above chart shows the millions of homeowners who hold mortgages that are worth more than the homes they are in. Any thinking person realizes that the only way home prices are justified at current levels would be if incomes shot up to make the ratio closer to 2.2. Over half a century of data and never did we have a housing bubble on a nationwide level. All of a sudden Glass-Steagall is repealed in 1999 and a housing bubble takes off with banks leading the way because the line between investment and commercial banking was blurred. Only those who want to deceive themselves would place blame elsewhere.
The average American is going to struggle throughout the next decade. It is hard to see how wages will go up so it is likely that home prices will adjust lower given the magnitude of foreclosures in the pipeline. People might be jumping up and down about the recent job growth but they are occurring in lower paying sectors. So this does nothing to justify current prices. Low mortgage rates are merely a gimmick so banks can use cheap money to speculate on a global scale. Even with mortgage rates at levels we've never seen the housing market remains stalled like an old car. Why? Because the actual sticker price is still inflated based on income levels.
We need to reform the banking system, break up investment and commercial banks, and finally restore sanity in the market. There is a reason the metrics are all off but nothing has been done to change this so we are only a short ways away from another crisis. Ireland for example can be likened to a homeowner that took on too much debt with too little income. So the international banking sector idea of a solution is to extend them a credit line? What they should do is tell the IMF and Euro to shove it, default, and start from scratch and learn from their mistake. Otherwise, they'll be in the same position as Americans who bailed out their corrupt banking sector.

No comments:
Post a Comment