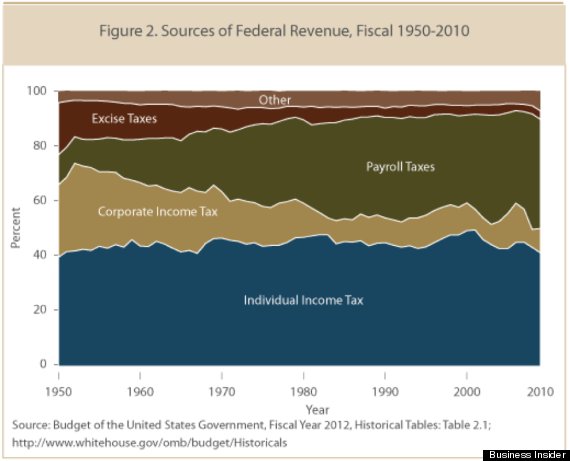
However, what's certain is that corporate taxes as a share of total U.S. tax revenue have gone down since the golden era of the 1950s, 60s and 70s. This is a strong indication that something is out of whack.
Meanwhile, payroll taxes that hit the low and middle class the hardest have ballooned in size, relatively.
What I also find interesting is how individual income tax as a source of federal revenue has remained fairly steady, despite the fact that many businesses are now allowed to pay tax as individuals. You might think, for example, that as corporate tax receipts went down, individual income tax receipts would go up, but that is not the case. This chart doesn't tell us enough to say why. But recessions and Dubya's tax cuts probably have something to do with it.
By Mark Gongloff
May 22, 2013 | Huffington Post
No comments:
Post a Comment